 How to Generate Automated PDF Documents with Python

 How to Generate Automated PDF Documents with Python
Discover how to leverage automation to create dazzling PDF documents effortlessly.
By Mohammad Khorasani, Data Scientist/Engineer Hybrid

Photo by Austin Distel on Unsplash
When was the last time you grappled with a PDF document? You probably don’t have to look too far back to find the answer to that question. We deal with a multitude of documents on a daily basis in our lives and an overwhelmingly large number of those are indeed PDF documents. It is fair to claim that a lot of these documents are tediously repetitive and agonizingly painful to formulate. It is about time we consider leveraging the power of automation with Python to mechanize the tedious so that we may reallocate our precious time to more pressing tasks in our lives.
Mind you, there is absolutely no need to be tech savvy and what we are going to do here should be trivial enough that our inner unsavvy laymen can tackle in short order. After reading this tutorial you will learn how to automatically generate PDF documents with your own data, charts and images all bundled together with a dazzling look and structure.
Specifically, in this tutorial we will automate the following actions:
- Creating PDF documents
- Inserting images
- Inserting text and numbers
- Visualizing data
Creating PDF Documents
For this tutorial, we will be using FPDF which is one of the most versatile and intuitive packages used to generate PDF’s in Python. Before we proceed any further, fire up Anaconda prompt or any other Python IDE of your choice and install FPDF:
pip install FPDFThen import the stack of libraries that we’ll be using to render our document:
import numpy as np
import pandas as pd
from fpdf import FPDF
import matplotlib as mpl
import matplotlib.pyplot as plt
from matplotlib.ticker import ScalarFormatter
Subsequently proceed with creating the first page of your PDF document and set the font with its size and color:
pdf = FPDF(orientation = 'P', unit = 'mm', format = 'A4')
pdf.add_page()
pdf.set_font('helvetica', 'bold', 10)
pdf.set_text_color(255, 255, 255)
You can however change the font whenever you like if you need to have various typefaces.
Inserting Images
The next logical step would be to give our document a background image that sets the structure for the rest of our page. For this tutorial I used Microsoft PowerPoint to render the formatting for my background image. I simply used text boxes and other visuals to create the desired format and once I was done I grouped everything together by selecting all the elements and hitting Ctrl-G. Finally I saved the grouped elements as a PNG image by right clicking on them and selecting ‘save as picture’.
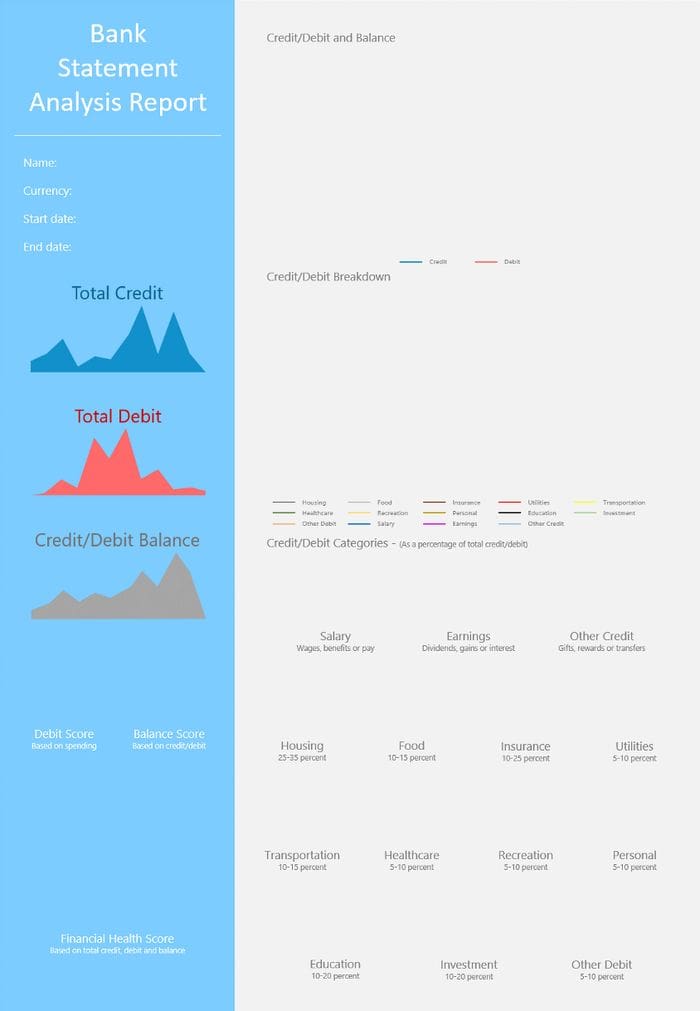
Background image. Image by author.
As you can see above, the background image sets the structure for our page and includes space for charts, figures, text and numbers that will be generated later on. The specific PowerPoint file used to generate this image can be downloaded here.
Subsequently insert the background image into your PDF document and configure its position with the following:
pdf.image('C:/Users/.../image.png', x = 0, y = 0, w = 210, h = 297)Please note that you can insert as many images as you like by extending the method shown above.
Inserting Text and Numbers
Adding text and numbers can be done in two ways. We can either specify the exact location we want to place the text:
pdf.text(x, y, txt)Or alternatively, we can create a cell and then place the text within it. This method would be more suitable for aligning or centering variable or dynamic text:
pdf.set_xy(x, y)
pdf.cell(w, h, txt, border, align, fill)
Please note that in the methods above:
- ‘x’ and ‘y’ refer to the specified location on our page
- ‘w’ and ‘h’ refer to the dimensions of our cell
- ‘txt’ is the string or number that is to be displayed
- ‘border’ indicates if a line must be drawn around the cell (0: no, 1: yes or L: left, T: top, R: right, B: bottom)
- ‘align’ indicates the alignment of the text (L: left, C: center, R: right)
- ‘fill’ indicates whether the cell background should be filled or not (True, False).
Visualizing Data
In this part we are going to create a bar chart that will display a timeseries dataset of our credit, debit and balance values versus time. For this we will use Matplotlib to render our figures as such:
In the snippet above, credit, debit and balance are 2-dimensional lists with values for date and transaction amount respectively. Once the chart is generated and saved, it can then be inserted into our PDF document using the method shown in the previous sections.
Similarly, we can generate donut charts with the following snippet of code:
And once you are all done, you can wrap it up by generating the automated PDF document as such:
pdf.output('Automated PDF Report.pdf')
Conclusion
And there you have it, your very own automatically generated PDF report! Now you’ve learnt how to create PDF documents, insert text and images into them and you’ve also learnt how to generate and embed charts and figures. But you are by no means limited to just that, in fact you can extend these techniques to include other visuals with multiple page documents too. The sky is truly the limit.

Image by author.
If you want to learn more about Python and data visualization, then feel free to check out the following (affiliate linked) courses: Python for Everybody Specialization and Data Visualization with Python. In addition, feel free to explore more of my tutorials here.
Bio: Mohammad Khorasani is a hybrid of a data scientist and an engineer. Logistician. Candid. Realpolitik. Unlearning dogma one belief at a time. Read more of Mohammad's writings.
Original. Reposted with permission.
Related:
- Data Scientists, You Need to Know How to Code
- 5 Tasks To Automate With Python
- How to Make Python Code Run Incredibly Fast