 Shapash: Making Machine Learning Models Understandable
 Shapash: Making Machine Learning Models Understandable
Establishing an expectation for trust around AI technologies may soon become one of the most important skills provided by Data Scientists. Significant research investments are underway in this area, and new tools are being developed, such as Shapash, an open-source Python library that helps Data Scientists make machine learning models more transparent and understandable.
By Yann Golhen, MAIF, Lead Data Scientist.
Shapash by MAIF is a Python Toolkit that facilitates the understanding of Machine Learning models to data scientists. It makes it easier to share and discuss the model interpretability with non-data specialists: business analysts, managers, and end-users.
Concretely, Shapash provides easy-to-read visualizations and a web app. Shapash displays results with appropriate wording (preprocessing inverse/post-processing). Shapash is useful in an operational context as it enables data scientists to use explicability from exploration to production: You can easily deploy local explainability in production to complete each of your forecasts/recommendations with a summary of the local explainability.
In this post, we will present the main features of Shapash and how it operates. We will illustrate the implementation of the library on a concrete use case.
Elements of context
Interpretability and explicability of models are hot topics. There are many articles, publications, and open-source contributions about it. All these contributions do not deal with the same issues and challenges.
Most data scientists use these techniques for many reasons: to better understand their models, to check that they are consistent and unbiased, as well as for debugging.
However, there is more to it:
Intelligibility matters for pedagogic purposes. Intelligible Machine Learning models can be debated with people that are not data specialists: business analysts, final users…
Concretely, there are two steps in our Data Science projects that involve non-specialists:
Exploratory step & Model fitting
At this step, data scientists and business analysts discuss what is at stake and define the essential data they will integrate into the projects. It requires understanding the subject well and the main drivers of the problem we are modeling.
To do this, data scientists study global explicability, features importance, and which role the model’s top features play. They can also locally look at some individuals, especially outliers. A Web App is interesting at this phase because they need to look at visualizations and graphics. Discussing these results with business analysts is interesting to challenge the approach and validate the model.
Deploying the model in a production environment
That’s it! The model is validated, deployed, and gives predictions to the end-users. Local explicability can bring them a lot of value, only if there is a way to provide them with a good, useful, and understandable summary. It will be valuable to them for two reasons:
- Transparency brings trust: They will trust models if they understands them.
- Human stays in control: No model is 100% reliable. When they can understand the algorithm’s outputs, users can overturn the algorithm suggestions if they think they rest on incorrect data.
Shapash has been developed to help data scientists to meet these needs.

Shapash key features
- Easy-to-read visualizations, for everyone.
- A web app: To understand how a model works, you have to look at multiple graphs, features importance, and global contribution of a feature to a model. A web app is a useful tool for this.
- Several methods to show results with appropriate wording (preprocessing inverse, post-processing). You can easily add your data dictionaries, category-encodersobject, or sklearn ColumnTransformer for more explicit outputs.
- Functions to easily save Picklefiles and to export results in tables.
- Explainability summary: the summary is configurable to fit with your need and to focus on what matters for local explicability.
- Ability to easily deploy in a production environment and to complete every prediction/recommendation with a local explicability summary for each operational apps (Batch or API)
- Shapashis open to several ways of proceeding: It can be used to easily access results or to work on better wording. Very few arguments are required to display results. But the more you work with cleaning and documenting the dataset, the clearer the results will be for the end-user.
Shapash works for Regression, Binary Classification, or Multiclass problems. It is compatible with many models: Catboost, Xgboost, LightGBM, Sklearn Ensemble, Linear models, SVM.
Shapash is based on local contributions calculated with Shap (shapley values), Lime, or any technique which allows computing summable local contributions.
Installation
You can install the package through pip:
$pip install shapash
Shapash Demonstration
Let’s use Shapash on a concrete dataset. In the rest of this article, we will show you how Shapash can explore models.
We will use the famous “House Prices” dataset from Kaggle to fit a regressor and predict house prices! Let’s start by loading the Dataset:
import pandas as pd
from shapash.data.data_loader import data_loading
house_df, house_dict = data_loading('house_prices')
y_df=house_df['SalePrice'].to_frame()
X_df=house_df[house_df.columns.difference(['SalePrice'])]
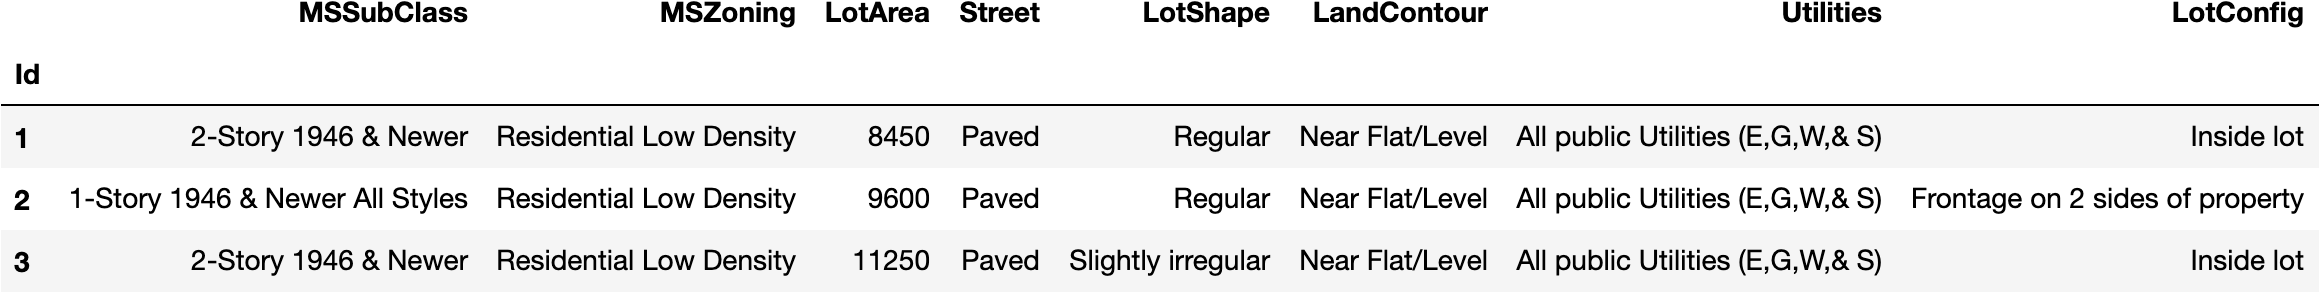
house_df.head(3)
Encode the categorical features:
from category_encoders import OrdinalEncoder

categorical_features = [col for col in X_df.columns if X_df[col].dtype == 'object']
encoder = OrdinalEncoder(cols=categorical_features).fit(X_df)
X_df=encoder.transform(X_df)
Train, test split and model fitting:
from sklearn.model_selection import train_test_split
from sklearn.ensemble import RandomForestRegressor

Xtrain, Xtest, ytrain, ytest = train_test_split(X_df, y_df, train_size=0.75)
reg = RandomForestRegressor(n_estimators=200, min_samples_leaf=2).fit(Xtrain,ytrain)
And predict test data:
y_pred = pd.DataFrame(reg.predict(Xtest), columns=['pred'], index=Xtest.index)
Let’s discover and use Shapash SmartExplainer.
Step 1 — Import
from shapash.explainer.smart_explainer import SmartExplainer
Step 2 — Initialise a SmartExplainer Object
xpl = SmartExplainer(features_dict=house_dict) # Optional parameter
- features_dict: dict that specifies the meaning of each column name of the x pd.DataFrame.
Step 3 — Compile
xpl.compile(
    x=Xtest,
    model=regressor,
    preprocessing=encoder,# Optional: use inverse_transform method
    y_pred=y_pred # Optional
)
The compile method permits to use of another optional parameter: postprocess. It gives the possibility to apply new functions to specify to have better wording (regex, mapping dict, …).
Now, we can display results and understand how the regression model works!
Step 4 — Launching the Web App
app = xpl.run_app()
The web app link appears in Jupyter output (access the demo here).
There are four parts to this Web App:
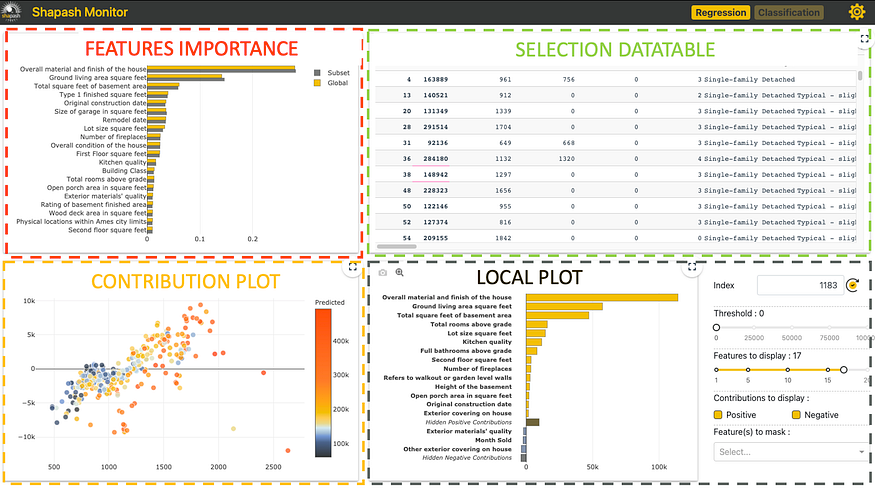
Each one interacts to help to explore the model easily.
Features Importance: you can click on each feature to update the contribution plot below.
Contribution plot: How does a feature influence the prediction? Display violin or scatter plot of each local contribution of the feature.
Local Plot:
- Local explanation: which features contribute the most to the predicted value.
- You can use several buttons/sliders/lists to configure the summary of this local explainability. We will describe below with the filter method the different parameters you can work your summary with.
- This web app is a useful tool to discuss with business analysts the best way to summarize the explainability to meet operational needs.
Selection Table: It allows the Web App user to select:
- A subset to focus the exploration on this subset
- A single row to display the associated local explanation
How do you use the data table to select a subset? At the top of the table, just below the name of the column that you want to use to filter, specify:
- =Value, >Value, <Value
- If you want to select every row containing a specific word, just type that word without “=”
There are a few options available on this web app (top right button). The most important one is probably the size of the sample (default: 1000). To avoid latency, the web app relies on a sample to display the results. Use this option to modify this sample size.
To kill the app:
app.kill()
Step 5 — The plots
All the plots are available in jupyter notebooks, and the paragraph below describes the key points of each plot.
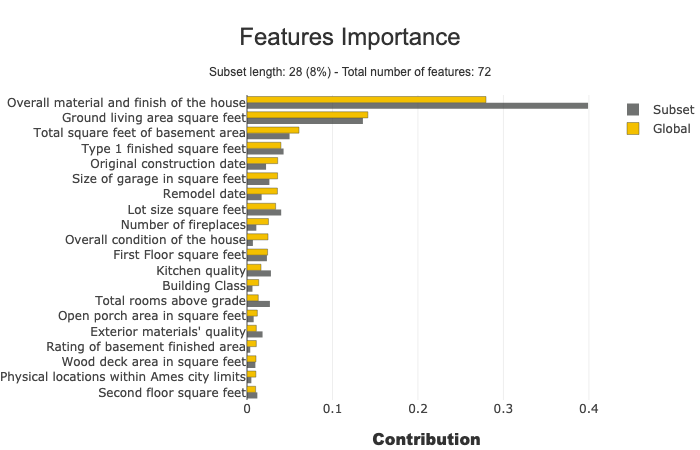
Feature Importance
This parameter allows comparing features importance of a subset. It is useful to detect specific behavior in a subset.
subset = [ 168, 54, 995, 799, 310, 322, 1374,
          1106, 232, 645, 1170, 1229, 703, 66,
          886, 160, 191, 1183, 1037, 991, 482,
          725, 410, 59, 28, 719, 337, 36 ]
xpl.plot.features_importance(selection=subset)
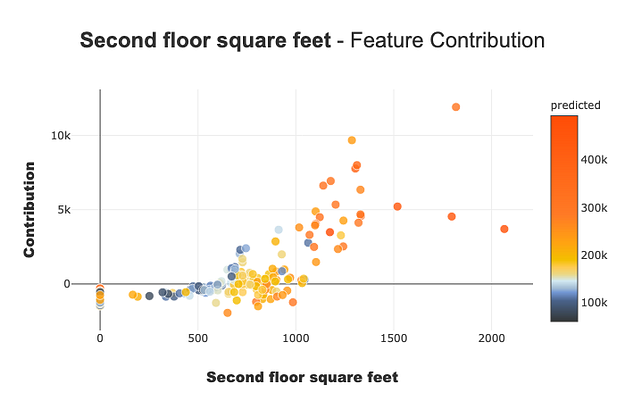
Contribution plot
Contribution plots are used to answer questions like:
How a feature impacts my prediction? Does it contribute positively? Is the feature increasingly contributing? decreasingly? Are there any threshold effects? For a categorical variable, how does each modality contributes? This plot completes the importance of the features for the interpretability, the global intelligibility of the model to better understand the influence of a feature on a model.
There are several parameters on this plot. Note that the plot displayed adapts depending on whether you are interested in a categorical or continuous variable (Violin or Scatter) and depending on the type of use case you address (regression, classification).
xpl.plot.contribution_plot("OverallQual")
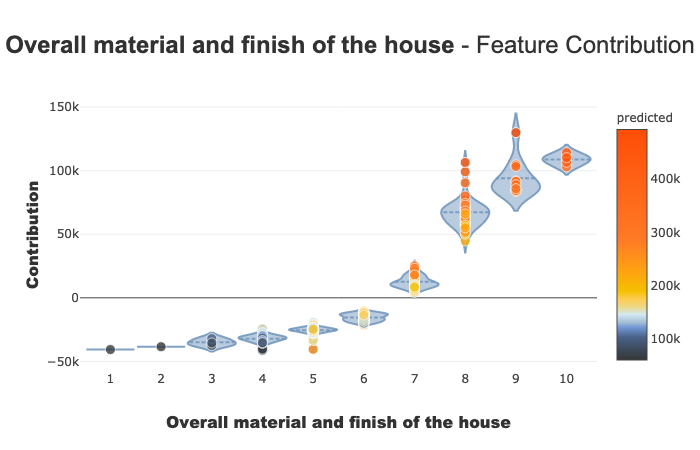
Contribution plot applied to a continuous feature.
Classification Case: Titanic Classifier — Contribution plot applied to categorical feature.

Local plot
You can use local plots for local explainability of models.
The filter() and local_plot() methods allow you to test and choose the best way to summarize the signal that the model has picked up. You can use it during the exploratory phase. You can then deploy this summary in a production environment for the end-user to understand in a few seconds what are the most influential criteria for each recommendation.
We will publish a second article to explain how to deploy local explainability in production.
Combine the filter and local_plot methods
Use the filter method to specify how to summarize local explainability. You have four parameters to configure your summary:
- max_contrib: maximum number of criteria to display
- threshold: minimum value of the contribution (in absolute value) necessary to display a criterion
- positive: display only positive contribution? Negative? (default None)
- features_to_hide: list of features you don’t want to display
After defining these parameters, we can display the results with the local_plot() method, or export them with to_pandas().
xpl.filter(max_contrib=8,threshold=100)
xpl.plot.local_plot(index=560)

Export to pandas DataFrame:
xpl.filter(max_contrib=3,threshold=1000)
summary_df = xpl.to_pandas()
summary_df.head()

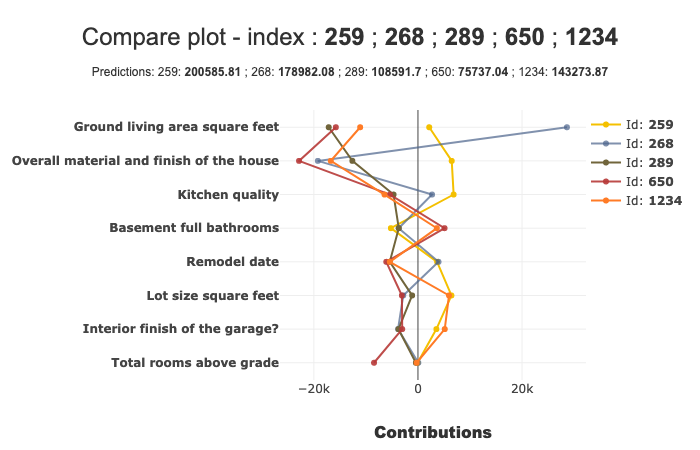
Compare plot
With the compare_plot() method, the SmartExplainer object makes it possible to understand why two or more individuals do not have the same predicted values. The most decisive criterion appears at the top of the plot.
xpl.plot.compare_plot(row_num=[0, 1, 2, 3, 4], max_features=8)
We hope that Shapash will be useful in building trust in AI. Thank you in advance to all those who will give us their feedback, idea… Shapash is opensource! Feel free to contribute by commenting on this post or directly on the GitHub discussions.
Original. Reposted with permission.
Related: