Pandas Profiling: One-Line Magical Code for EDA
EDA can be automated using a Python library called Pandas Profiling. Let’s explore Pandas profiling to do EDA in a very short time and with just a single line code.
By Juhi Sharma, Product Analyst
Automated Exploratory Data Analysis using the Pandas Profiling Python Library
Exploratory Data Analysis is an approach for exploring/analyzing datasets to generate insights in visual form. EDA is used to understand the main characteristics of the dataset.
EDA helps us to know missing values, count, mean, median, quantiles, distribution of data, correlation of variables with each other, data type, the shape of data, etc. For EDA we need to write so many lines of code which takes a lot of time.
To make EDA easier and faster, we can write One-Line Magical Code for EDA.
EDA can be automated using a Python library called Pandas Profiling. It is a great tool to create reports in the interactive HTML format which is quite easy to understand and analyze the data. Let’s explore Pandas Profiling to do EDA in a very short time and with just a single line code.
Installation of Pandas Profiling:
Installation with the pip package
!pip install pandas-profilingInstallation with the conda package
conda install -c conda-forge pandas-profiling
Loading Data Set
In this article, I have used the Titanic Data Set.
import pandas as pd

df=pd.read_csv(“titanic2.csv”)

df.head()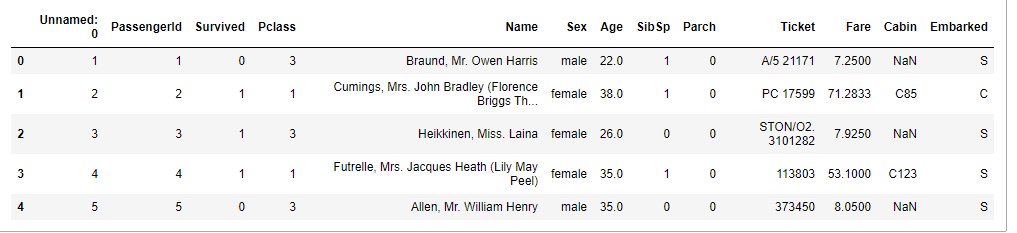
Description of Attributes of the Data set
survived — Survival (0 = No; 1 = Yes)
Pclass — Passenger Class (1 = 1st; 2 = 2nd; 3 = 3rd)
name — Name of passengers
sex — Gender (Male/Female)
age — Age
Sibsp — Number of Siblings/Spouses Aboard
Parch — Number of Parents/Children Aboard
Ticket — Ticket Number
Fare — Passenger Fare
Cabin — Cabin
Embarked — Port of Embarkation (C = Cherbourg; Q = Queenstown; S = Southampton)
Code to run pandas_profiling on our data frame which returns the Pandas Profiling Report.
import pandas_profiling as pp

pp.ProfileReport(df) #to display the report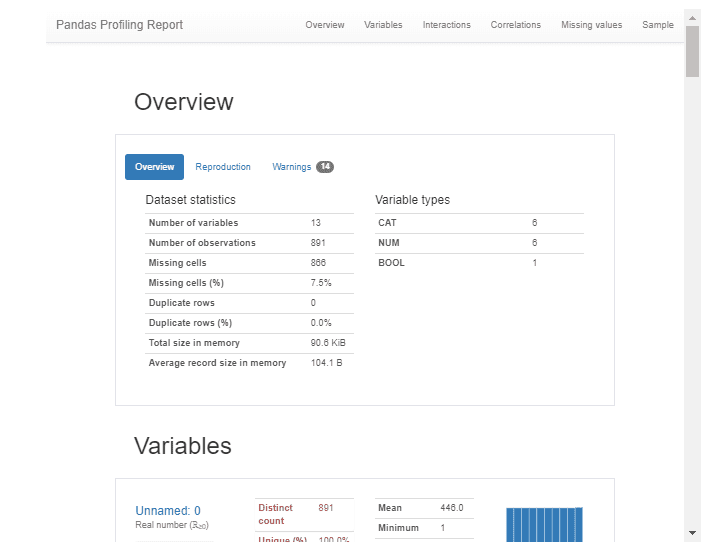
You can see that our Pandas Profiling EDA report is ready with the help of 1 line of code.
Pandas Profiling Report Consists of the Following Sections:
- Overview
- Variables
- Interactions
- Co-relations
- Missing Values
- Sample
1. Overview Section :
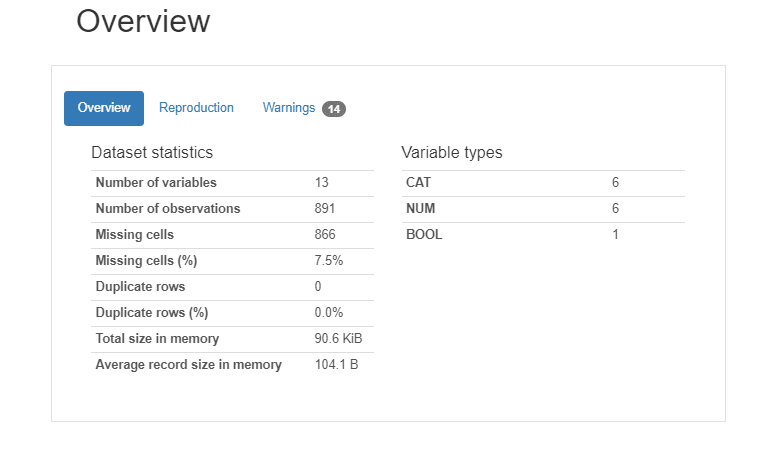
This section provides overall data set information. Dataset statistics and Variable types.
Dataset statistics display columns, rows, missing values, etc.
Variable Types shows data types of the attributes of the data set. It also shows “Warnings”, where it shows which feature(s) are highly correlated to others.
2. Variable Section
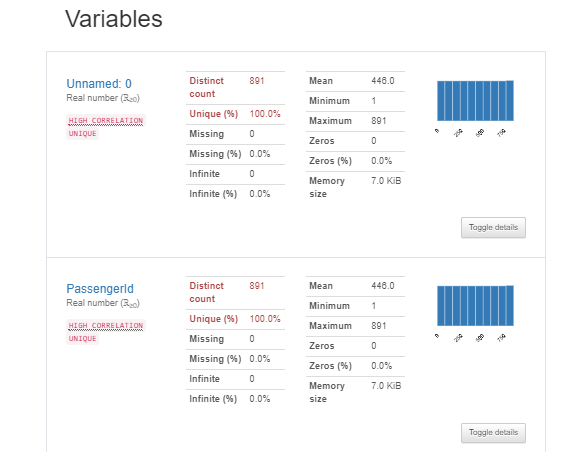
This section provides information about every feature individually in detail. When we click on the Toggle details option as shown in the above image, the new section shows up.
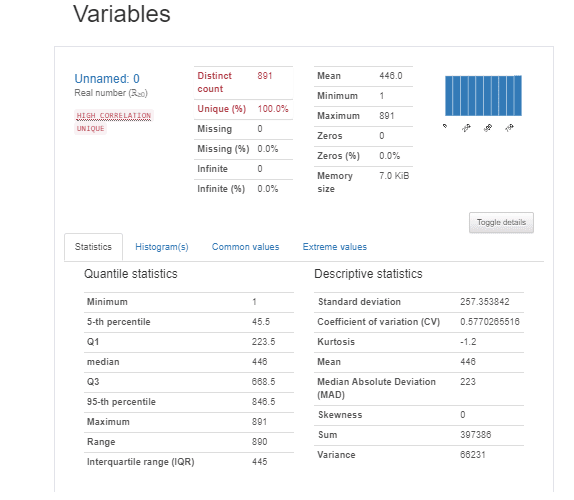
This section shows statistics, histograms, common values, and extreme values of features.
3.Correlation Section
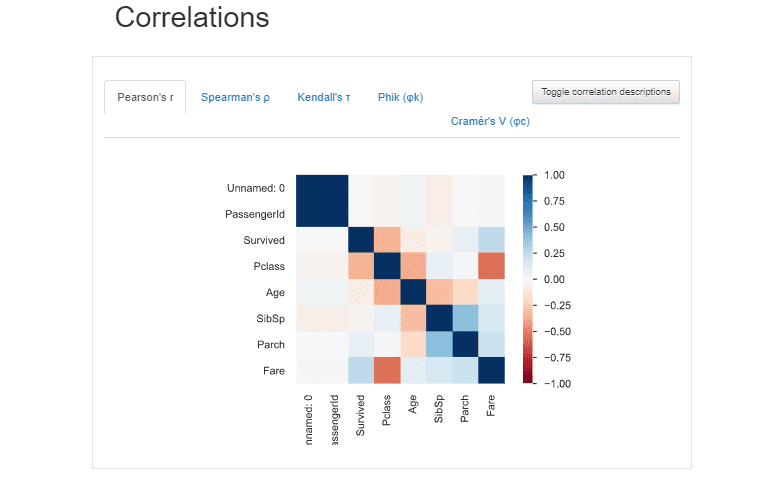
This Section shows how features are co-related with each other with the help of Seaborn’s Heatmap. We can easily toggle between the different types of correlations like Pearson, Spearman, Kendall, and phik.
4. Missing Value Section
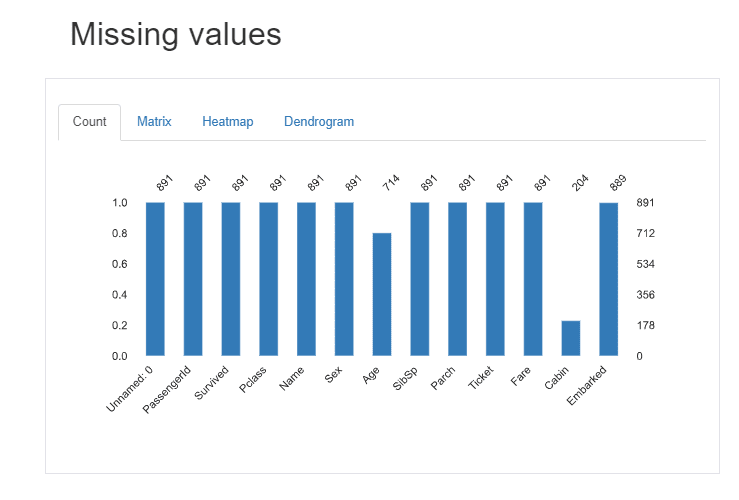
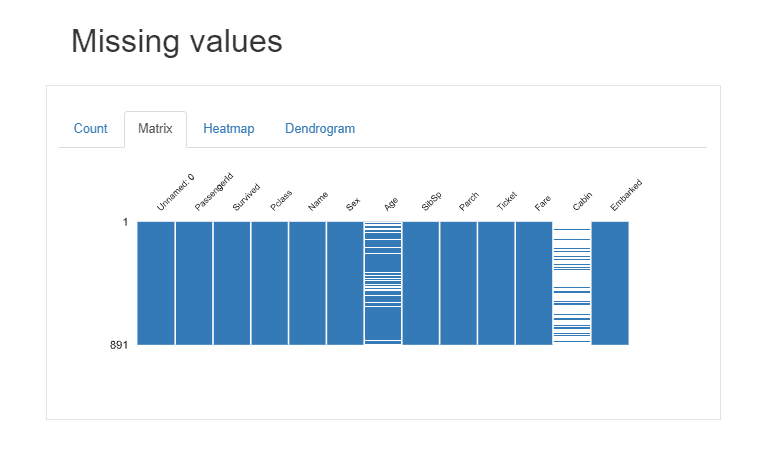
We can see the Missing values in the “Age” and “Cabin” Column from Count and Matrix Graph shown above.
5.Sample Section
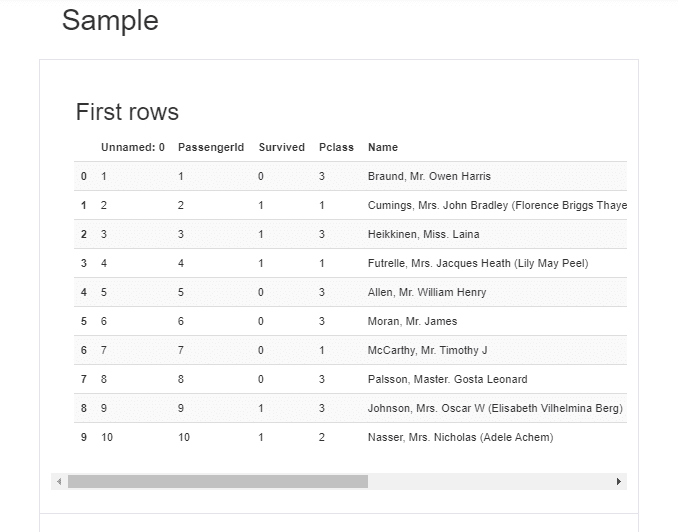
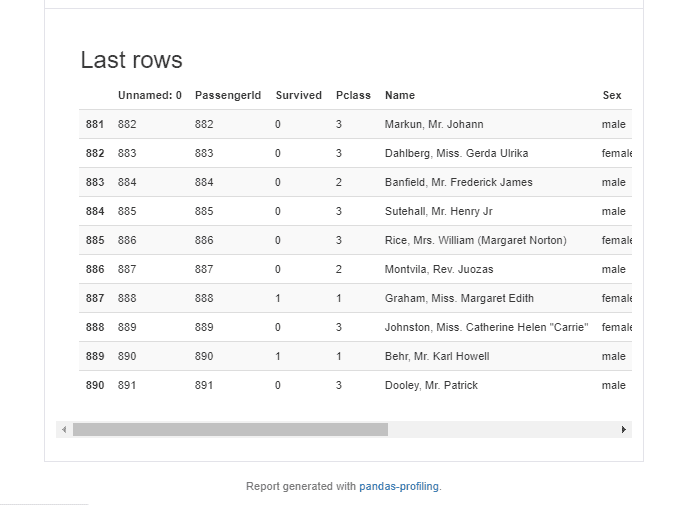
This section displays the First 10 Rows and the Last 10 rows of the dataset.
I hope the ‘Pandas Profiling’ Library will help to get a faster and easy analysis of data. So what do you think about this beautiful library? Go ahead try this and mention your experiences in the response section.
Before You Go
Thanks for reading! If you want to get in touch with me, feel free to reach me on jsc1534@gmail.com or my LinkedIn Profile.
Bio: Juhi Sharma (Medium) is passionate about solving business problems by data-driven approaches, including data visualization, machine learning, and deep learning. Juhi is pursuing Master's in Data Science and has 2.2 years of work experience as an analyst.
Original. Reposted with permission.
Related:
- Powerful Exploratory Data Analysis in just two lines of code
- Merging Pandas DataFrames in Python
- Cleaner Data Analysis with Pandas Using Pipes