 Data Visualization Cheat Sheet
 Data Visualization Cheat Sheet
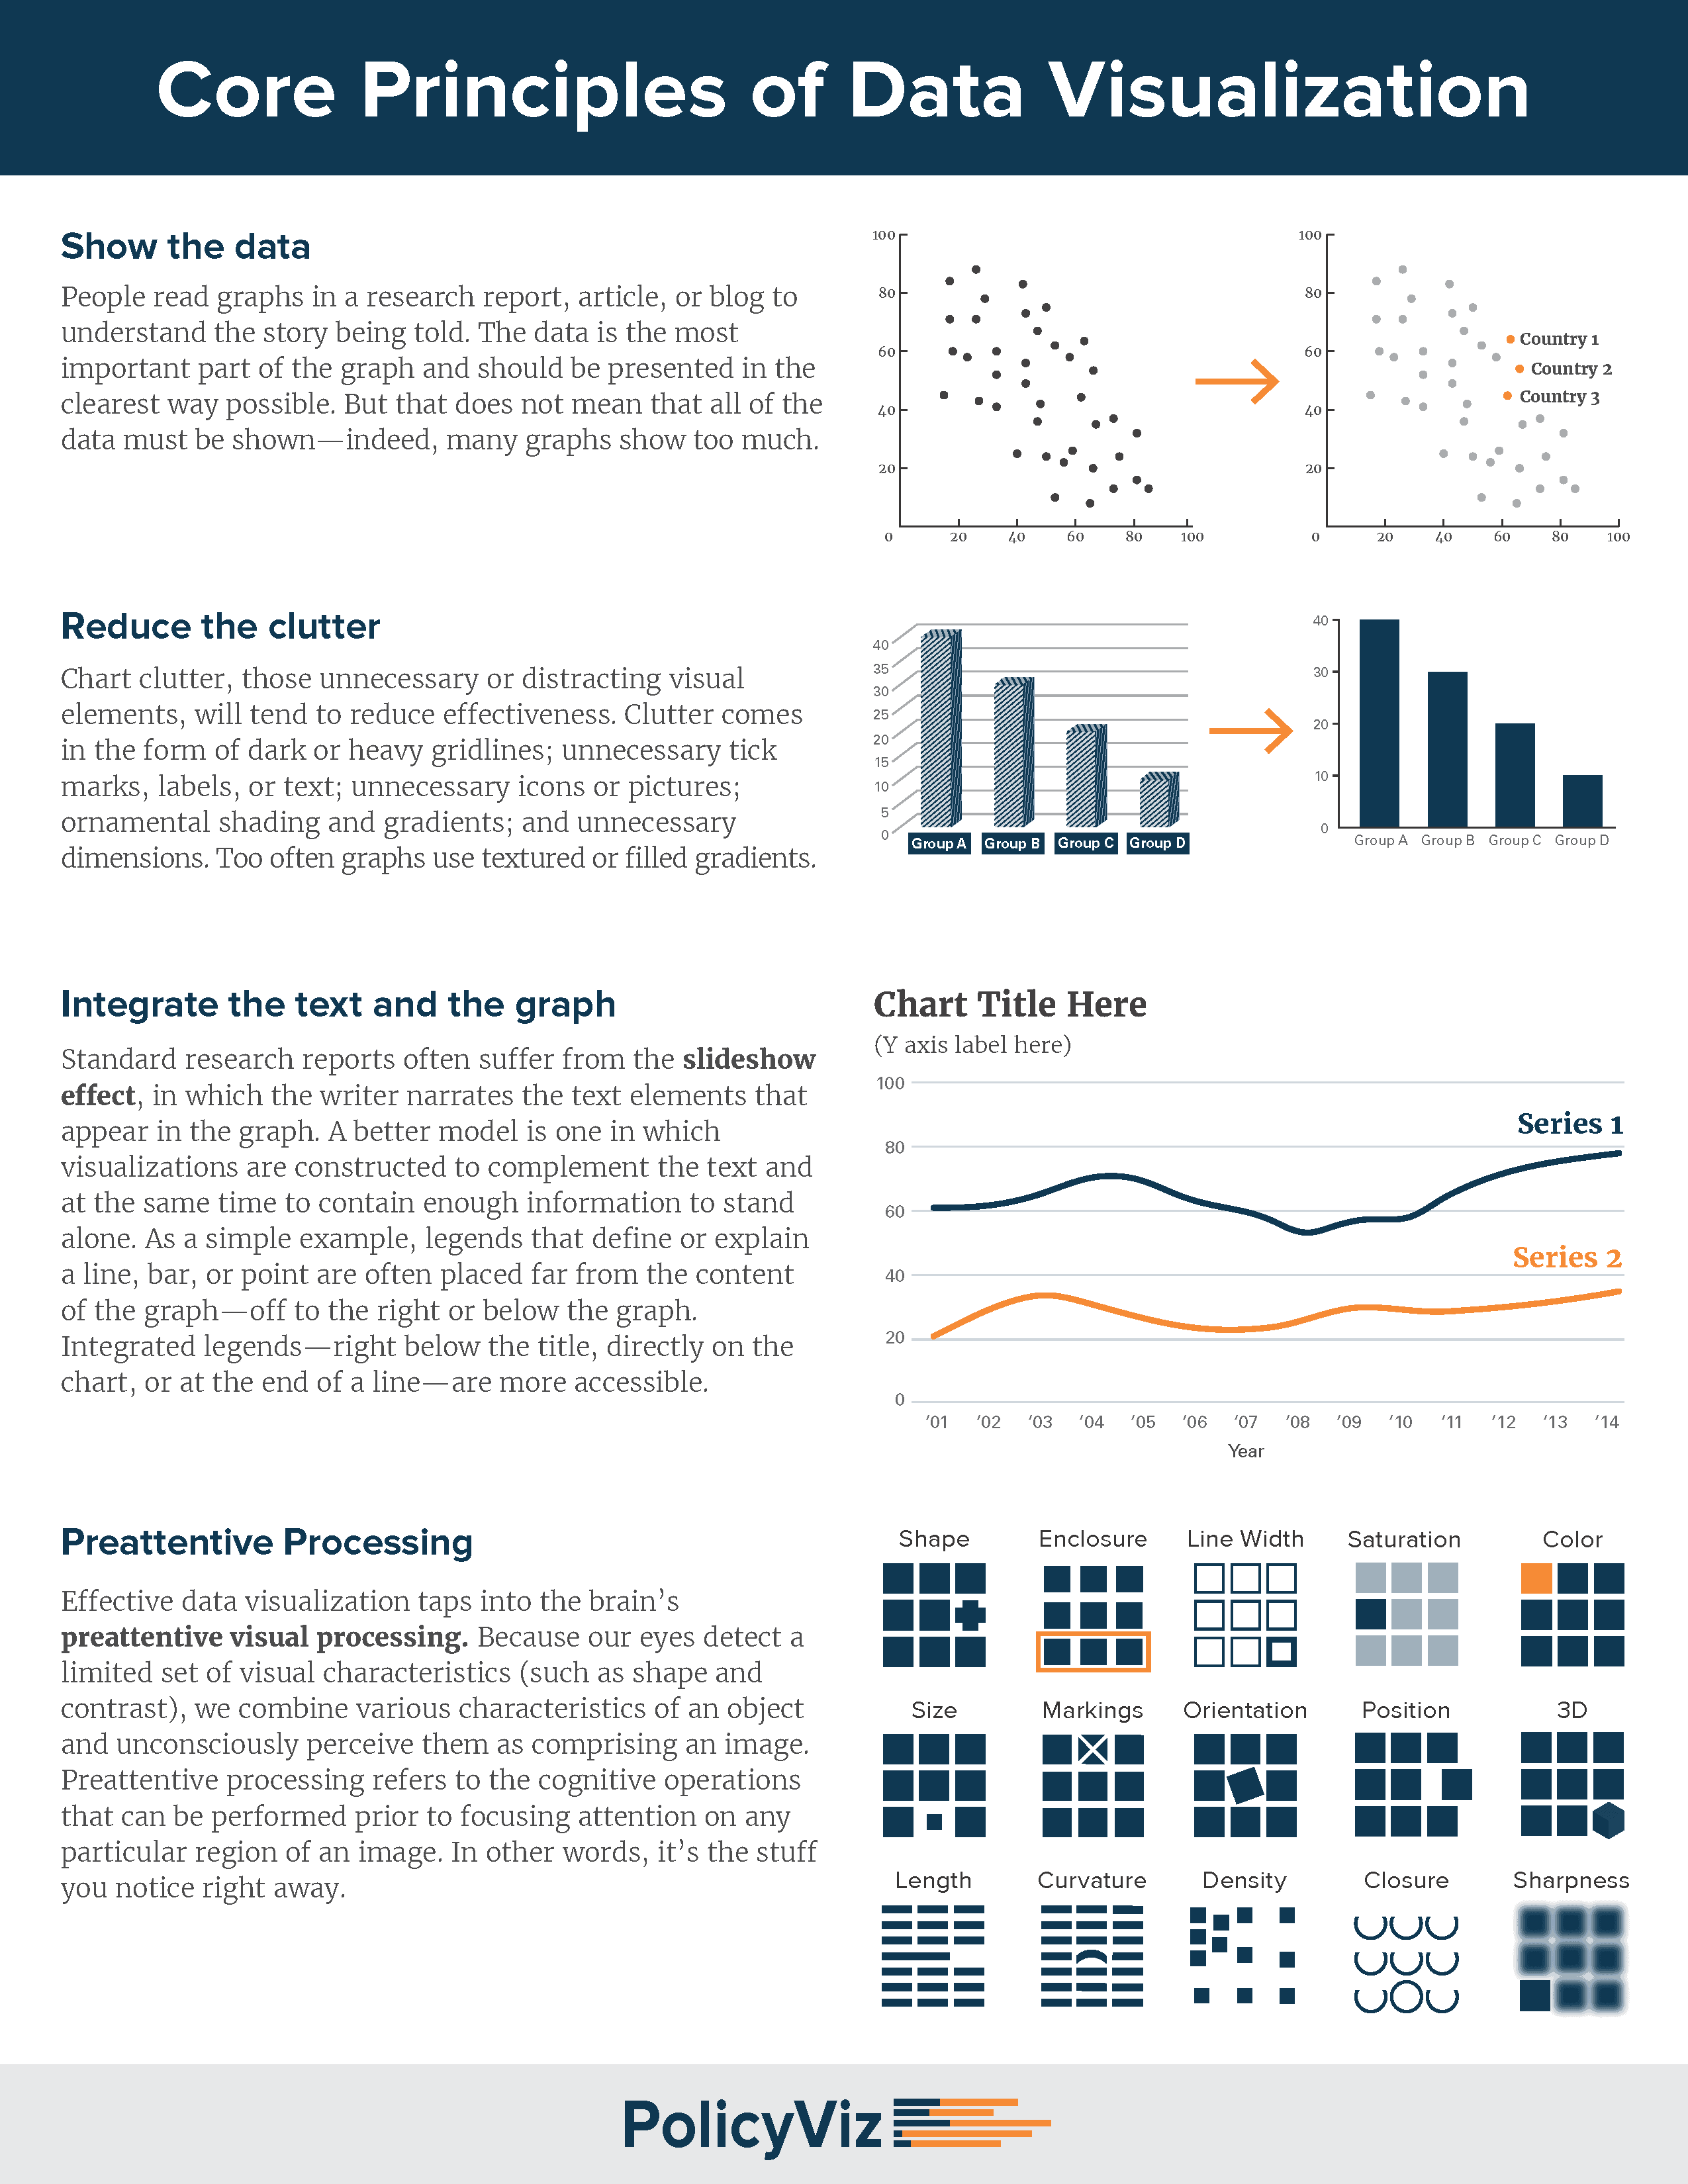
Core principles for successful data visualization, including tips on how to reduce clutter, preattentive processing and how to integrate text within the graph.
By Jon Schwabish, PolicyViz.
I'm a big believer that anyone can learn how to communicate their data in better ways. I’ve published more than 130 podcast episodes, and I don’t think any of my guests have come directly to data visualization, but instead have come from a range of areas like journalism, astronomy, economics, business, government, and more.
When it comes to learning how to best visualize your data, there is a plethora of great books, websites, blogs, and podcasts. In my Core Principles classes and workshops, I provide this cheat sheet as a summary of some of the core lessons. Obviously, this doesn’t cover everything, but I think it serves as a good reminder of best practices and core things to keep in mind.
You can take a look at the image versions below or download the high-res PDF version for yourself.

Bio: Jon Schwabish is a Senior Fellow in The Urban Institute’s Income and Benefits Policy Center and a member of the Institute’s Communication team where he specializes in data visualization and presentation design. He blogs at Policyviz.com.
Original. Reposted with permission.
Related:
- The future of Big Data, Machine Learning and Data Visualization in Europe
- Interpreting a data set, beginning to end
- GitHub Python Data Science Spotlight: AutoML, NLP, Visualization, ML Workflows