Stagraph – a general purpose R GUI, for data import, wrangling, and visualization
Stagraph is a new simple visual interface for R, which focuses on data import, data wrangling and data visualization.
By Milos Gregor, Hydrooffice.org
R programming language is currently an important and widely used tool for data wrangling, statistical processing and data visualization. Its main strength is a well-designed language and huge number of external packages that extend its use to many areas. On the other hand, the price for this functionality is its complexity for beginners and occasional users. These problems can be partially solved by graphical user interfaces. One of these visual interfaces is Stagraph.
At present, there are a number of visual interfaces that allow you to use R language functionality without the need for code writing. The list can be found, for example here. Besides the graphical user interfaces (GUI), we know also integrated development environments (IDE). The difference between GUI and IDE is the need to manually write R scripts.
R GUI apps can be divided into general-purpose or special. Useful GUI applications frequently focus on a selected portion of R language functionality or on a selected R package. Conversely, general-purpose GUI apps provide access to a larger amount of generic R functions. An example can be RKWard or R Commander. These R GUIs can be used to import data from multiple sources, modify them and then analyze using several statistical functions.
Stagraph is an example of a general-purpose R GUI application. Stagraph focuses on data import, data wrangling and data visualization. These are core functions that forms the base of any data analysis. Functions are based on R packages from the Tidyverse group. With Stagraph, you can use these features without the knowledge of R language. On the other hand, if you are skilled in R language, you can use it on multiple levels.
The basis is data import. For these purposes, Stagraph offers several tools to import data from files on disk or from databases (via ODBC connection). In addition, Stagraph integrates into the interface data from selected R packages. An example of this can be map datasets that you can instantly use for your analysis and visualizations. An overview of the data import options is displayed in the following video.
If you have input data imported, it is often necessary to modify them before use (data wrangling). It is necessary to control, format and filter them, compute new variables or combine with data from other sources. For these purposes Stagraph using R packages from the Tidyverse group (dplyr, tidyr, lubridate, forcats and stringr). A quick overview of options is displayed in the following video. Stagraph contains 87 built-in functions for data wrangling.
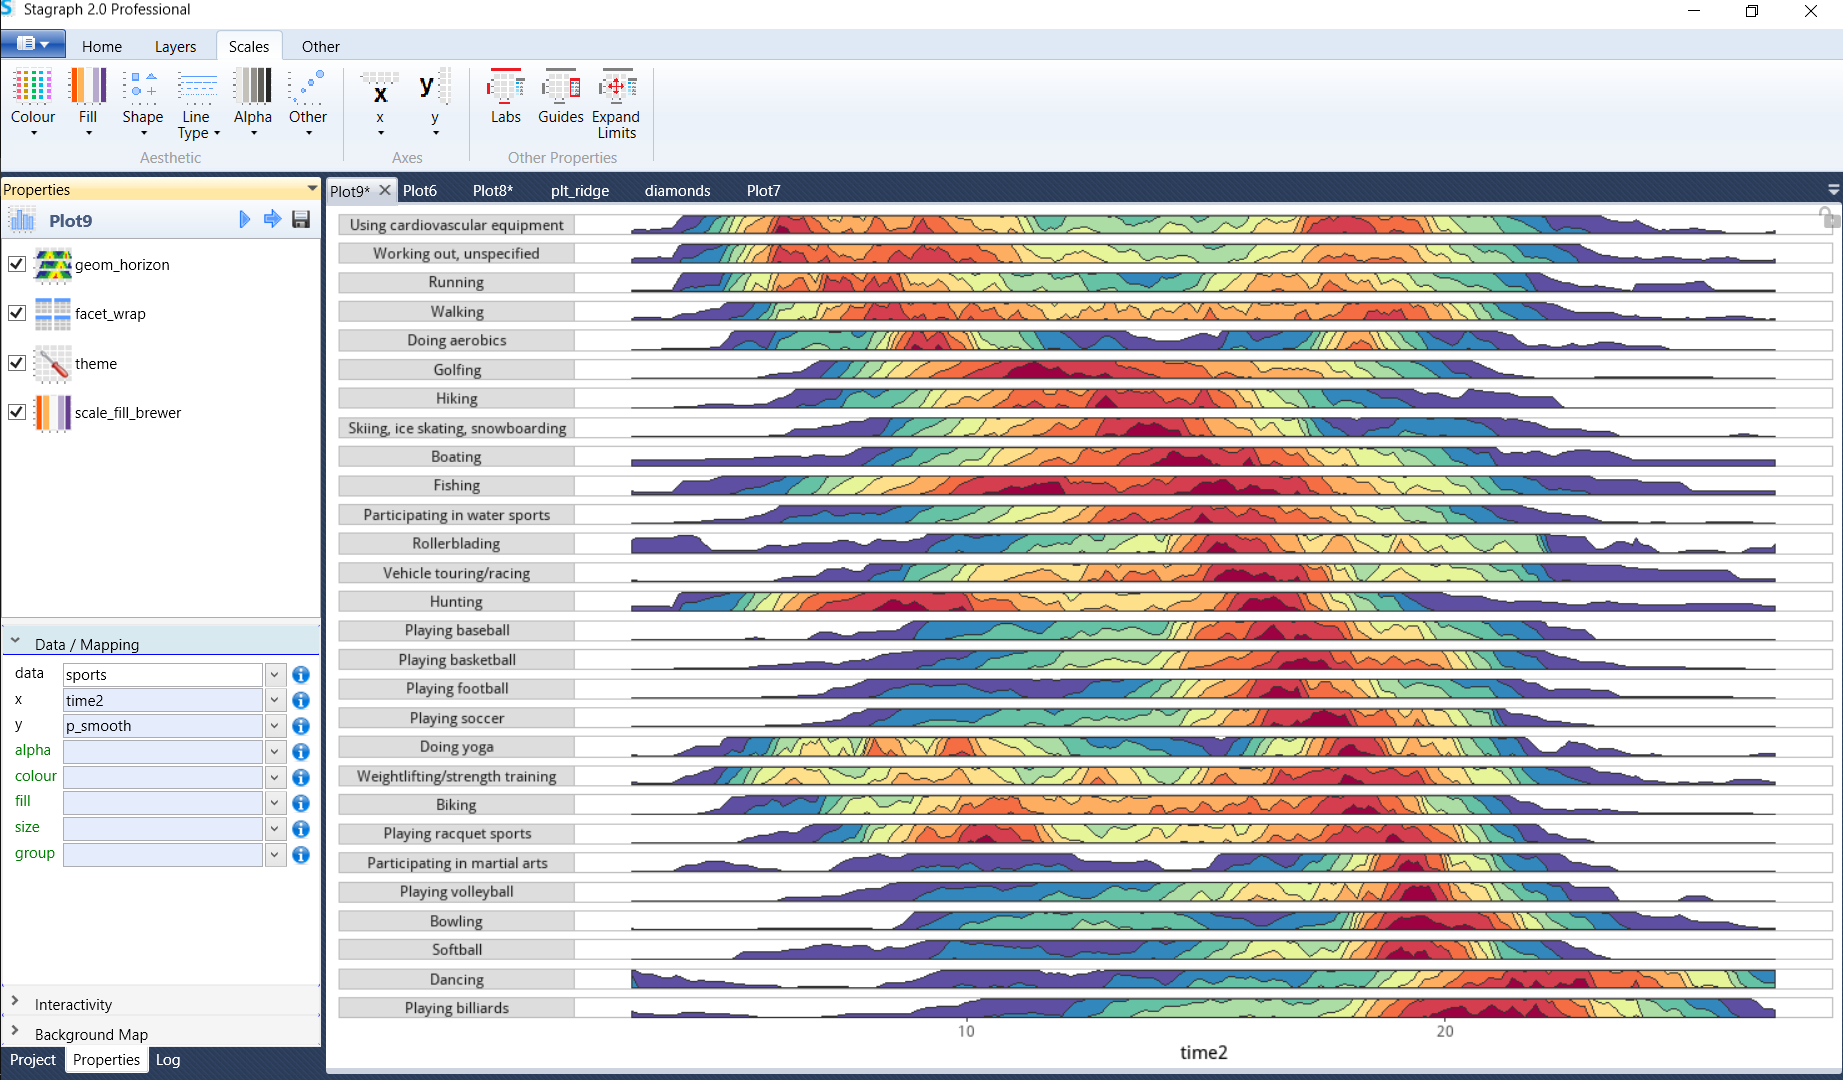
Cleaned data needs to be understood - visually explored. Statistical graphics is in Stagraph based on the Grammar of Graphics, implemented in ggplot2 package. With this R package, you can create impressive visualizations very quickly by combining simple functions and objects. For these purposes, you can use 80 geometry layers, 50 statistical functions, 7 annotation layers, 90 scales, 7 coordinate systems, 6 plot faceting options and 28 plot themes. Examples of Stagraph data visualizations are shown in the following video.
Adjusted data and created visualizations can be published outside the Stagraph interface. Stagraph allows to publish your results in static or interactive forms. You can publish them in offline or online mode. Finally, all of your work can be exported from the program as R scripts. You can use these scripts outside the program environment. As example can be mentioned R Visuals in Power BI Desktop software. Selected examples of publishing are displayed in the last video.
From previous text and intro videos, it is clear that Stagraph is focused on general-purpose functionality that is usable without regard to the area of use. By combining the provided features, you can process your data quickly and relatively simply. After understanding the basic principles you will find that the question is not whether you can do anything in Stagraph, but how.
Stagraph is released under the Freemium license. You can import your data from any source without restrictions also in the Free version. Functions from the data wrangling group are not limited. Restrictions can be found when creating data visualizations - only selected set of basic geometries can be used in your data visualizations.
Stagraph can significantly help you in the learning of R language. If you understand the basic logic of grammar of graphics and grammar of data, it will be easy for you to learn and use them in the form of scripts written in R. Stagraph can be your entry gateway to the world of R. If you eventually move to pure R language, you will not lose your previous projects, because they can be exported from Stagraph as readable R scripts with one click.
Bio: Milos Gregor is a hydrogeologist, data scientist, and software developer (hydrooffice.org, stagraph.com, gisxl.com)
Related: