Applied Data Science: Solving a Predictive Maintenance Business Problem Part 2
In this post we will discuss further on how exploratory analysis can be used for getting insights for feature engineering.
By Thomas Joseph, Aspire Systems

In the first part of the applied data science series, we discussed about first three phases of the data science process namely business discovery, data discovery and data preparation. In business discover phase we talked on how the business problem i.e. predicting end life of batteries, defines the choice of variables that comes into play. In the data discovery phase we discussed data sufficiency and other considerations like variety and velocity of data and how these considerations affect the data science problem formulation. In the last phase we touched upon how the data points and its various constituents drive the predictive problem formulation. In this post we will discuss further on how exploratory analysis can be used for getting insights for feature engineering.
Exploratory Analysis – Unraveling latent trends
This phase entails digging deep to get a feel of the data and extract intuitions for feature engineering. When embarking upon exploratory analysis, it would be a good idea to get inputs from domain team on the relation between variables and the business problem. Such inputs are often the starting point for this phase.
Let us now get to the context of our preventive maintenance problem and evolve a philosophy for exploratory analysis.In the case of industrial batteries, a key variable which affects the state of health of a battery is its conductance. It turns out that an indicator of failing health of battery is the precipitous drop in conductance. Armed with this information our next task should be to identify, from our available data set,batteries that have higher probability to fail. Since precipitous fall in conductance is an indicator of failing health,the conductance data of unhealthy batteries will have more variance than the normal ones. So the best way to identify failing batteries from the normal ones would be to apply some consolidating metric like standard deviation or variance on the conductance data and further drill deep on samples which stand apart from the normal population.
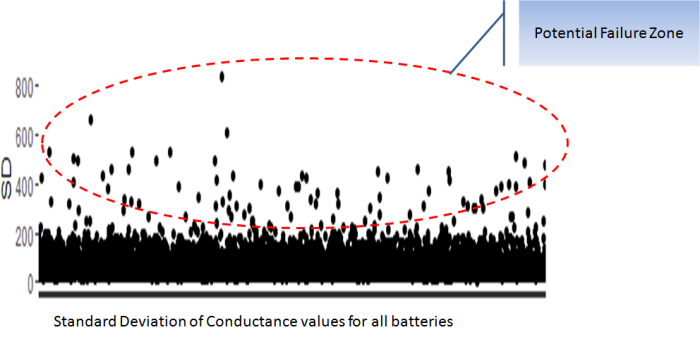
The above is a plot depicting standard deviation of conductance for all batteries. Now what might be of interest to us is the red zone which we can call the “Potential failure Zone”. The potential failure zone consists of those batteries whose conductance values show high standard deviation. Batteries with failing health are likely to exhibit large fall in conductance and as a corollary their values will also show higher standard deviation. This implies that the samples of batteries which have higher probability of failure will in all likelihood be from this failure zone. However to ascertain this hypothesis we will have to dig deep into batteries in the failure zone and look for patterns which might differentiate them from normal batteries. Another objective to dig deep is also to elicit clues from the underlying patterns on what features to include in the predictive model. We will discuss more on the feature extraction when we discuss about feature engineering. Now let us come back to our discussion on digging deep into the failure zone and ferreting out significant patterns. It has to be noted that in addition to the samples in the failure zone we will also have to observe patterns from the normal zone to help separate wheat from the chaff . Intuitions derived by observing different patterns would become vital during feature engineering stage.
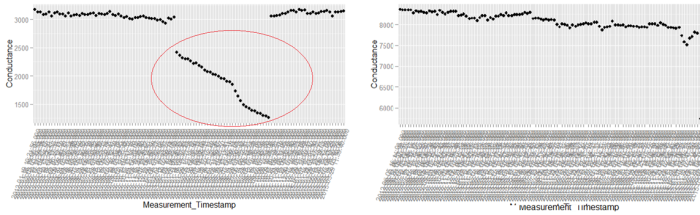
The above figure is a comparison of patterns from either zones. The figure on the left is from the failure zone and the one on the right is from the other. We can clearly see how the precipitous fall is manifested in the sample from the failure zone. The other aspect to note is also the magnitude of the fall. Every battery will have degrading conductance over time. However the magnitude of degradation is what differentiates the unhealthy battery from a normal one. We can observe from the plot on the left that the fall in conductance is more than 50%, however for the battery to the right the drop is more muted. Another aspect we can observe is the slope of conductance. As evident from the two plots, the slope of conductance profile for the battery on the left is much more steeper over time than the one on the right. These intuitions which we have derived so far might become critical from the overall scheme of feature engineering and modelling. Similar to the intuitions which we have disinterred so far, more could be extracted by observing more samples. The philosophy behind exploratory analysis entails visualizing more and more samples, observing patterns and extracting clues for feature engineering. The more time we spend on doing this more ammunition we get for feature engineering.
Wrapping up
So far we discussed different considerations for the exploratory analysis phase. To summarize, here are some of the pointers during this phase.
- Take inputs from domain team related to the problem we are trying to solve. In our case the clue which we got was the relation between conductance and health of batteries.
- Identify any consolidating metric for the variable under consideration to separate out anomalous samples. In the example above we used standard deviation of conductance values to find anomalies.
- Once the samples are demarcated using the consolidation metric, visualize samples from different sets to identify discernible patterns in data.
- From the patterns we observe root out clues for feature engineering. In our example we identified that % fall in conductance and slope of conductance over time could be potential features.
The above pointers are general guidelines on how one should think through during exploratory analysis phase.
The discussions so far were centered on exploratory analysis on a single variable. Next we have to connect other variables to the one which we already observed and identify trends in unison. When we combine trends from multiple variables we will be able to unravel more insights for feature engineering. We will continue our discussions on combining more variables and subsequent feature engineering in our next post. Watch out this space for more.
Bio: Thomas Joseph is Senior Data Scientist at Aspire Systems, working on growing the Data Science footprint and enabling superior delivery.
Original. Reposted with permission.
Related:
- Applied Data Science: Solving a Predictive Maintenance Business Problem
- Mind of a Data Scientist – Part 1
- Mind of a Data Scientist – Part 2